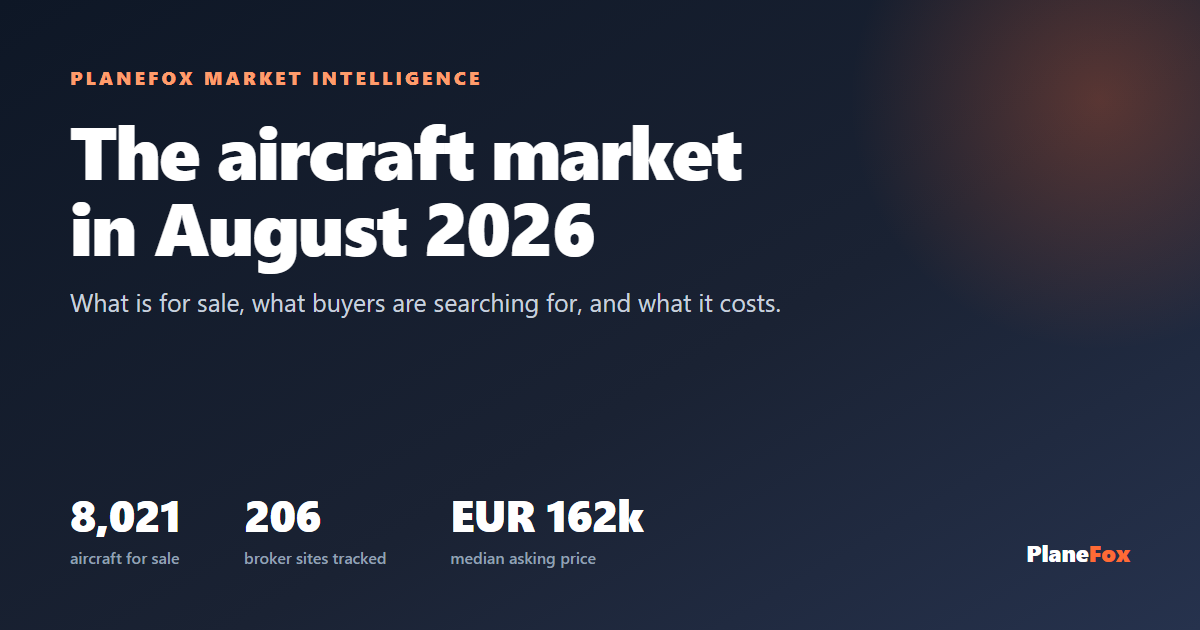
The first edition of PlaneFox Market Intelligence. We track 206 broker and marketplace sites and match every aircraft against Google search demand, so this is a view of the market that no single broker can see from their own inventory.
Read the full report with all the charts and tables
The short version:
- There are 8,021 aircraft for sale across 206 sites we track, spanning 654 model families in 56 countries. Just over half of them, 52.3%, carry a public price. The median ask is EUR 162k.
- Helicopters and jets punch far above their weight. Helicopters are 10.7% of the aircraft on sale but pull 26.6% of buyer enquiries, roughly two and a half times their share of the shelf. Single engine pistons are the mirror image: 51.3% of the market, 31.3% of the enquiries.
- Buyers are hunting types nobody is selling. The Pilatus PC-24 draws 11,067 Google searches a month across five European markets with 6 for sale. The Gulfstream G650 sees 12,637 searches against 10 aircraft.
- Search demand is broadly rising. Of the 108 models with enough search volume to judge, 68 are trending up against the same months last year.
- Sellers are cutting, not raising. Since we began recording price changes in July we have logged 551 reductions against 220 increases. The typical cut is 8.0% off the previous ask. In August, cuts outnumbered rises five to one.
What is on the market
Single engine pistons dominate by volume at 51.3% of all listings, with a median asking price of EUR 140k. Jets are 11.6% of the aircraft but carry a median ask of EUR 2.6M, so they represent a far larger share of the market by value than by count.
The most heavily supplied model families are the ones you would expect from any European ramp:
- Cessna 172 Skyhawk: 309 for sale, median EUR 99k
- Cessna 182 Skylane: 290 for sale, median EUR 191k
- Cirrus SR22: 242 for sale, median EUR 397k
- Robinson R44: 190 for sale, median EUR 309k
- Piper PA-28 Cherokee: 157 for sale, median EUR 70k
- Piper PA-28 Arrow: 153 for sale, median EUR 112k
Germany and the United Kingdom together hold roughly a third of the listings we can place on a map.
What buyers are actually searching for
This is the part most brokers never get to see. We pull monthly Google search volume for every model in our taxonomy across Germany, Italy, Spain, Poland and the United Kingdom, then compare the most recent three months against the same months a year earlier. It is a read on buyer intent that is completely independent of who happens to be advertising.
The models climbing fastest right now:
- Cessna 425 Conquest I: +301% demand trend, 625 searches a month, 5 for sale
- PZL M18 Dromader: +191% demand trend, 908 searches a month, 1 for sale
- Gulfstream G800: +189% demand trend, 11,042 searches a month, 0 for sale
- Cirrus Vision Jet SF50: +173% demand trend, 689 searches a month, 18 for sale
- Cirrus SR20: +138% demand trend, 4,501 searches a month, 124 for sale
- Cessna Citation Latitude: +100% demand trend, 1,158 searches a month, 3 for sale
Search interest includes research and enthusiasm as well as buying intent, so we treat these as a conversation starter rather than a shopping list. Airliners and warbirds are excluded from the rankings for the same reason.
Where demand outruns supply
Divide monthly searches by the number of aircraft actually for sale and you get a rough measure of how thin the shelf is. At the top of that list:
- Pilatus PC-24: 1,844 searches per aircraft on the market (11,067 searches, 6 listed)
- Gulfstream G650: 1,264 searches per aircraft on the market (12,637 searches, 10 listed)
- Pilatus PC-12: 512 searches per aircraft on the market (12,283 searches, 24 listed)
- Tecnam P2006T: 378 searches per aircraft on the market (3,783 searches, 10 listed)
- Bell 412: 320 searches per aircraft on the market (1,922 searches, 6 listed)
- Cessna Citation X: 294 searches per aircraft on the market (2,058 searches, 7 listed)
At the other end sit the types where supply is comfortable and competition is really about price and presentation: the Piper PA-34 Seneca at 5 searches per aircraft, the Piper PA-28 Cherokee at 7, and the Cessna 172 Skyhawk at 8. If you are selling one of those, presentation and pricing carry the sale.
What we are not publishing yet
The obvious question about any aircraft market is how long things take to sell. We are not answering it in this edition, and we want to be straight about why.
PlaneFox only began systematically recording the moment a listing disappears in July 2026. Any average we calculated today would mostly measure when our own checks ran rather than how long aircraft actually take to sell. We would rather leave a headline number out than publish one that looks authoritative and is not. The next edition will carry a like for like time to sale series, measured from a full observation window.
For the same reason this edition is a baseline rather than a trend report. Month on month changes in listing counts are still dominated by new broker sites joining the platform. Future editions compare against this one.
Read the full report
The full edition has the charts, the model by model price benchmarks, average asking price by year of build for the best represented families, the demand pressure breakdown by segment and the complete methodology.
Open the August 2026 market report
If you are a broker or dealer and want a cut of this data for your own fleet, or you spot something that looks wrong, write to hi@planefox.com. We would rather hear it than publish it twice.